The Oracle SPARC T8-2 is a 2 processor server with Oracle SPARC M8 Processors (each with 32 x 8 dynamically threading cores running at 5GHz) and Oracles “Software-in-Silicon” technology to massively accelerate operations such as SQL Primitives on OLTP Oracle Databases, Java applications, Queries of large, compressed databases in-memory and operations involving floating point data, virtualization using Solaris 11 and encryption all with little to no additional processor overhead.
DAX Units (Data Analytics Accelerator)
DAX Units operate on data at full memory speeds, taking advantage of the very high memory bandwidth of the processor. This results in extreme acceleration of in-memory queries and analytics operations (i.e. generating data about your database data) while the processor cores are freed up to do other useful work.
DAX Units can handle compressed data on the fly, so larger DB’s can be held in memory and with less memory needed to be configured for a given database size.
The DAX Unit can also be exploited to handle Java applications whereby the available API is used by the Java application developers.
Oracle Numbers Units
These software-in-silicon units greatly accelerate Oracle database operations involving floating point data. This results in fast, in-memory analytics on your database without affecting your OLTP (Online Transaction Processing) operations.
Silicon Secured Memory
This is capable of detecting and preventing invalid operations on application data via hardware monitoring of software access to memory. A hardware approach is must faster than a software based detection tool that places additional overhead on your processors.
Each core contains the fastest cryptographic acceleration in the industry with near zero overhead.
Dynamic Threading Technology
Each of the 2 processors has 32 cores, each capable of handling 8 threads using dynamic threading technology that adapts to extreme single-thread performance or massive throughput 256 thread performance on the fly.
Efficient design with Solaris Virtualization technology means that a much larger number of VMs can be supported compared with Intel Xeon based systems, lowering per-VM cost.
Summary
This breakthrough in SPARC is enabled by the Solaris 11 OS.
Secure, Integrated, Open platform engineered for large scale enterprise cloud environments with unique optimization for oracle databases, middleware and application deployments. Security is easily set up and enabled by default with single-step patching to the OS running on the logical domain, hosting immutable zones that allow compliance to be maintained easily.
You can create complete application software stacks, lock them securely, deploy them in a cloud and update them in a single step.
Oracle Solaris 11 combines unique management options with powerful application driven software-defined networking for agile deployment of cloud infrastructure.
More here, including full hardware specification, summarized below.
Specifications
PROCESSOR
Thirty-two core, 5.0 GHz SPARC M8 processor
Up to 256 threads per processor (up to 8 threads per core)
Eight Data Analytics Accelerator units per processor, each supporting four concurrent in-memory analytics engines with decompression
Thirty two on chip encryption instruction accelerators (one per core) with direct non-privileged support for 16 industry standard cryptographic algorithms: AES, Camellia, CRC32c, DES, 3DES, DH,
DSA, ECC, MD5, RSA, SHA-1, SHA-224, SHA-256, SHA-3, SHA-384, and SHA-512
Thirty two floating point units and thirty two Oracle Numbers units per processor (one per core)
One random number generator (one per processor)
CACHE PER PROCESSOR
Level 1: 32 KB instruction and 16 KB data per core
Level 2: 256 KB L2 I$ per four cores, 128 KB L2 D$ per core
Level 3: 64 MB L3$ on chip System Configuration
SPARC T8-2 servers are always configured with two SPARC M8 processors; not expandable
MEMORY
Sixteen dual inline memory module (DIMM) slots per processor supporting half and fully populated memory configurations using 16, 32, or 64 GB DDR4 DIMMs
2 TB maximum memory configuration with 64 GB DIMMs
INTERFACES
Network: Four 10 GbE (100 Mb/sec, 1 Gb/sec, 10 Gb/sec)ports, full duplex only, auto-negotiating
Disks and internal storage: Two SAS-3 controllers providing hardware RAID 0, 1, and 1E/10(ZFS file system provides higher levels of RAID)
Expansion bus: Eight low-profile PCIe 3.0 (four x8 and four x16) slots
Ports: Four external USB (two front USB 2.0 and two rear USB 3.0), one RJ45 serial management port, console 100Mb/1Gb network port, and two VGA ports (one front, one rear)
MASS STORAGE AND MEDIA
Internal storage: Up to six 600 GB or 1,200 GB 2.5-inch SAS-3 drives
Optional internal storage may be installed within the standard drive bays
800 GB solid-state drives (SSDs), maximum of six 6.4 TB NVMe drives, maximum of four
Did you like this? Tip cyberfella with Cryptocurrency
This concise post is intended to provide a terminology and concepts reference for the Oracle M5-32 and M6-32 Servers, the Domain Configurable Units (DCU’s) of which are divided into one isolated to four combined “Bounded (1)” or “Non-bounded (2-4)” Physical Domains. The combined or “non-bounded” DCU’s are connected via the Scalability Switchboards in order to combine their resources into a single Physical Domain. Each Physical Domain can be further divided into 192/384 Logical Domains on M5-32 or M6-32 Servers by using “Oracle VM Server for SPARC” software. Each Logical Domain runs it’s own instance of the Oracle Solaris 11 operating system that can run thousands of Zones. Each zone is a means of isolating applications running on the same Solaris 11 operating system instance. Each zone contains a controlled environment through which you can allocate the exact resources an application requires. More on Zones in a separate, complimenting post. This post covers the server hardware layer through to the zone layer in the technology stack (illustrated below).
Oracle M5-32 and M6-32 Servers
DCU’s provide the building blocks of Physical Domains.
A Physical Domain operates as a server with full hardware isolation from the other physical domains.
DCU’s can be combined or divided into 1 – 4 physical domains to suit business application requirements.
Each Physical Domain can be restarted without affecting other Physical Domains in the M5-32 / M6-32 Server.
An initial hardware purchase of a minimum of 8 processors can be configured into 1 or 2 Physical Domains and the remainder purchased later for expansion.
A maximum of 32 processors and 32TB memory per M5/M6 Server is possible.
Scalability Switchboards
The physically separate DCU’s can be joined together to make a single Physical Domain that spans multiple Domain Configurable Units. The communications are serviced by the Scalability Switch Boards.
A “Bounded” Physical Domain is one whereby a single DCU is allocated to a single Physical Domain and is therefore not connected to the Scalability Switch Boards, isolating it from the other DCU’s.
A Bounded Physical Domain can operate on 2 processors, whereas non-bounded require a minimum of 4.
A single M5/M6 server can be a mix of Bounded and Un-bounded (combined) Physical Domains.
Supported Virtualization Software (LDOMs and Solaris Zones)
LDOMs
Oracle VM Server for SPARC is installed and supports the creation of 192/384 Logical Domains on M5-32/M6-32 Servers respectively.
Each LDOM can be configured and rebooted independently of the others.
Each LDOM runs its own instance of the Oracle Solaris 11 operating system.
Solaris Zones
Each instance of the Solaris 11 Operating System that comes pre-installed on each Logical Domain running Oracle VM Server supports Solaris Zones.
Each Zone contains a controlled environmen through which you can allocate the exact operating system resources that an application needs.
Zones are ultimately used to isolate applications running on the same instance of Solaris 11 in the same Logical Domain so that they don’t interfere with each other in terms of pre-alocated resource maximums and also files written to the underlying OS file system.
Solaris 11 supports thousands of zones on any given LDOM.
So, you’ve told vmware to create a fairly large disk out of one of the datastores, and it’s been ticking along nicely, then bam, an IO latency spike on your SAN has caused vmware to throw an error. You can see your .vmdk file on the datastore, but the vm can’t see it, and you can’t delete it. You’re left wondering whether “it’s doing anything or not” with no apparent way to tell in vSphere. Grr. You need information about vmware tasks.
ssh to the ESXi host
List all tasks running on host for all VMs
vim-cmd vimsvc/task_list
Obtain vmid of your VM
vim-cmd vmsvc/getallvms
Make a note of vmid
vim-cmd vmsvc/get.tasklist
Make a note of the task identifier – this is the number on the end of the task, i.e. ..sometask-3360′]
View task information
vim-cmd vimsvc/task_info
Look for the state=”running” field.
My blog posts are intended to be as concise as possible, since they are only intended to serve as a quick reminder on how I once did so-and-so. Official instructions for this particular topic are available from vmware’s knowledge base here…
To scan viruses on your Windows File Servers using local or block (SAN) storage is easy – you just install an AV agent on the Windows Server and voila. But what if your Windows File Server is replaced by an emc VNX CIFS Server?
The VNX uses an optional agent called CAVA (Common Anti-virus Agent) that enables a filter driver on the CIFS Server that sends the file off to a third party AV server for scanning. If a virus signature is found, the VNX subsequently deletes the file.
Here’s everything you need to set it up… (Note that versions described below may change over time).
emc CAVA for VNX Installation, Configuration and Administration
Create a Windows Server, preferably 2 or a couple of VMs and add to the domain.
Download VNX Common Event Enabler from here (291MB)…
You’ll need to register an account on support.emc.com if you don’t already have one (Powerlink account).
Install VNX Common Event Event Enabler 6.3.1 (includes CAVA) and a 3rd party AV product of your choice.
emc_VEE_Pack_x64_6.3.1.exe
You will also need to install <vnx nas version>_VNXFileCifsMgmt.exe which sadly is only available on CD2 of the Tools Pack that came with your VNX. If you’ve subsequently upgraded the NAS to a more recent version, you’ll need to obtain the latest software from EMC. I was able to download the elusive software from a link sent to me by EMC support, even though I couldn’t find it or search for it on Powerlink. The links below may work for you, it may not. Try it.
Start, Administrative Tools, Celerra Management,
Expand Data Mover Management (you’ll need to point it at the IP address of your CIFS interface)
Expand Anti-virus
Set file masks (don’t use *.*), and exclude files that don’t harbor viruses, configure CAVA CIFS Server name to exactly match that on the VNX CIFS Server name (may need to be in caps!), and IP addresses of CAVA AV Servers. Example viruschecker.conf shown below. How you get this into your viruschecker.conf is your problem. Personally, I’d take the easy option of using the gui, then manually edit the viruschecker.conf file using vi to fix any problems, remove square brackets and stuff. To edit the viruschecker.conf file manually on the datamover over ssh, log on as nasadmin, su to root and use these commands…
CIFSserver=globalcifsserver -Note that this CIFS Server must reside on physical DM, not your CIFS Server on VDM Addr=<IP addresses of AV engines separated by semi colons> eg 10.1.1.1:10.1.1.2 shutdown=viruschecking
Create a service account in the domain and check the user rights
Create a local group viruscheckers on the CIFS Server using the local users and groups snap-in, and add your service account in.
Make your service account a local admin on the CAVA Servers and double check that the debug programs right in group policy has local administrators in it (windows default setting) or put the cava service account in it. This is needed for the CAVA service to query the OS on the VM to determine the AV engine.
GPO_name\Computer Configuration\Windows Settings\Security Settings\Local Policies\User Rights Assignment Debug Programs
Restart the EMC CAVA service on the CAVA Vm’s using this service account – note: it’ll get assigned Log On As A Service rights automatically.
If you need to re-add rights to the CAVA service account in group policy for any reason (they’ve been stripped out in an update), then you’ll need to also restart the CAVA Service on the VM before the CAVA Agent on the Datamover will re-recognise the AV engine.
In the EMC Celerra Management snap-in
Expand User Rights Assignment
Expand EMC Virus Check
Add
Select the service account in the Domain to give virus checking right to, Add, OK, OK
PuTTY/SSH to VNX Control Station
Login as nasadmin server_viruschk server_2
You should see ONLINE, plus details of file masks and AV server used.
If you get Unknown AV Engine or Third Party AV engine, even though you’re using McAfee or Sophos or one of the other supported AV engines, then something is up – HP Protect Tools can get in the way of the DM authenticating to the CAVA VM’s. I’m using McAfee and although mcshield.exe is a known av engine and its running, it didn’t pick it up because the password was getting scrambled by ProtectTools. Check your AV policy being applied to the AV engine includes Network Drives. It may not. Until you solve this problem, set shutdown=viruschecking in your viruschecker.conf to shutdown=no to prevent it from stopping all the time. Use the snap-in to adjust this setting. Also make sure your viruschecker.conf is pointing as a global cifs server permanently resident on the physical datamover and not your cifs server on a virtual data mover thats actually sharing your filesystems.
server_viruschk server_2 -audit
Should see details of viruses caught. This can be tested using EICAR test virus and dropping the file into the CIFS Share on the CIFS Server.
The file should get automatically deleted by your anti-virus software.
Reboot everything once it’s all set up (CAVA Vm’s). A reboot can cure most problems.
Common Commands via the CLI
Replace server_x with the data mover you are accessing eg server_2
server_viruschk server_x Shows if virus checking is running and scanning rules
server_viruschk server_x -audit Shows CAVA scanning stats and scan queue. Very useful to see if the CAVA queue is blocked
server_log server_x To see if there are any errors on the data movers
server_setup server_x –P viruschk –o start=64 Start the virus checker service on the data mover
server_setup server_x –P viruschk –o stop Stop the virus checker service on the data mover
server_viruschk server_x –fsscan fs1 –create Starts a virus scanning job a on file system
server_viruschk server_x –fsscan fs1 –delete Stops a virus scanning job on a file system
server_viruschk server_x –fsscan fs1 –list Show the scanning status
Debugging CAVA
You can set debug logging on the data mover
.server_config server_2 “param viruschk Traces=0x00000004” #turns on debug for AV in the server_log
.server_config server_2 “param viruschk Traces=0x00000000” #turns off debug for AV in the server_log
server_log server_x To see if there are any errors logged on the data movers.
[paypal-donation]
Did you like this? Tip cyberfella with Cryptocurrency
Here is a handy cheat sheet in troubleshooting failing backups and recoveries using Dell/EMC Networker. All content here is taken from real-world experience (and is regularly updated).
Backup Architecture and things to check (at a glance)
Is backup server running?
Check the uptime and that the daemon log is being written to.
nsrwatch -s backupserver -Gives a console version of the NMC monitor
You may find mminfo and nsradmin commands are unsuccessful. The media database may be unavailable and/or you may receive “program not registered” error that usually implies the Networker daemons/services are not running on the server/client. This can also occur during busy times such as clone groups running (even though this busy-ness is not reflected in the load averages on the backup server.
Client config.
Can you ping the client / resolve the hostname or telnet to 7937?
Are the static routes configured (if necessary).
Can the client resolve the hostnames for the backup interfaces? have connectivity to them?
Does the backup server appear in the nsr/res/servers file?
Can you run this on the client?
save -d3 -s /etc
From the backup server (CLI)…
nsradmin -p 390113 -s client
Note: If the name field is incorrect according to nsradmin (happens when machines are re-commissioned without being rebuilt) then you need to stop nsrexecd, rename /nsr/nsrladb folder to /nsr/nsrladb.old, restart nsrexecd, and most importantly, delete and recreate the client on the networker backup server, before retrying the following command:
savegrp -vc client_name group_name
Also check that all interface names are in the servers file for all interfaces on all backup servers and storage nodes likely to back the client up.
Use excel to form a large csv, then use Notepad++ to remove commas. Be aware there is a comma in the aliases field, so use an alternative character in excel to represent this then replace it with a comma once all commas have been removed from the csv.
Add user to admin list on bu server
nsraddadmin -u user=username, host=*
where username is the username minus the domain name prefix (not necessary).
Reset NMC Password (Windows)
The default administrator password is administrator. If that doesn’t work, check to see that the GST service is started using a local system account (it is by default), then in Computer Management, Properties, Advanced Properties, create a System Environment Variable;
GST_RESET_PW=1
Stop and start the GST Service and attempt to logon to the NMC using the default username and password pair above.
When done, set
GST_RESET_PW=<null>
Starting a Backup / Group from the command line
On the backup server itself:
savegrp -D5 -G <group_name>
Ignore the index save sets if you are just testing a group by adding -I
Just backing up the :index savesets in a group:
savegrp -O -G <group_name>
On a client:
save -s <backup_server_backupnic_name> <path>
Reporting with mminfo
List names of all clients backed up over the last 2 weeks (list all clients)
Is the client configured properly in the NMC? (see diagram above for hints on what to check in what tabs)
How many files were backed up in each saveset (useful for counting files on a NetApp which is slow using the find command at host level)
sudo mminfo -ot -q 'client=mynetappfiler,level=full,savetime<7 days ago' -r 'name,nfiles'
name                    nfiles

/my_big_volume          894084
You should probably make use of the ssflags option in the mminfo report too, which adds an extra column regarding the status of the saveset displaying one or more of the following characters CvrENiRPKIFk with the common fields shown in bold below along with their meanings.
C Continued, v valid, r purged, E eligible for recycling, N NDMP generated, i incomplete, R raw, P snapshot, K cover, I in progress, F finished, k checkpoint restart enabled.
Check Client Index
nsrck -L7 clientname
Backing up Virtual Machines using Networker,VCentre and VADP
To back up virtual machine disk files on vmfs volumes at the vmware level (as opposed to the individual file level backups of the individual vm’s), networker can interface with the vcenter servers to discover what vm’s reside on the esxi clusters managed by them, and their locations on the vmfs shared lun. For this to work, the shared lun’s also need to be presented/visible to the VADP Proxy (Windows server with Networker client and/or Server running as a storage node) in the fc switch fabric zone config.
The communication occurs as shown in blue. i.e.
The backup server starts backup group containing vadp clients.
The vadp proxy asks vcentre what physical esxi host has the vm, and where the files reside on the shared storage luns.
The vadp proxy / networker storage node then tells the esxi host to maintain a snapshot of the vm while the vmdk files are locked for backup.
the vmdk files are written to the storage device (in my example, a data domain dedup device)
when the backup is complete, the client index is updated on the backup server, and the changes logged by the snapshot are applied to the now unlocked vmdk and then the snapshot is deleted on the esxi host.
Configuring Networker for VADP Backups via a VADP Proxy Storage Node
The VADP Proxy is just a storage node with fibre connectivity to the SAN and access to the ESXi DataStore LUNs.
In Networker, right click Virtualisation, Enable Auto Discovery
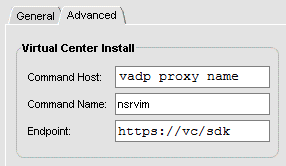
Complete the fields, but notice there is an Advanced tab. This is to be completed as follows… not necessarily like you’d expect…
Note that the Command Host is the name of the VADP Proxy, NOT the name of the Virtual Center Server.
Finally, Run Auto Discovery. A map of the infrastructure should build in the Networker GUI
Ensure vc, proxy and networker servers all have network comms and can resolve each others names.
You should now be ready to configure a VADP client.
Configuring a VADP client (Checklist)
GENERAL TAB
IDENTITY
COMMENT application_name – VADP
VIRTUALIZATION
VIRTUAL CLIENT
(TICK)
PHYSICAL HOST client_name
BACKUP
DIRECTIVE
VCB DIRECTIVE
SAVE SET *FULL*
SCHEDULE
Daily Full
APPS AND MODULES TAB
BACKUP
BACKUP COMMAND nsrvadp_save -D9
APPLICATION INFORMATION
VADP_HYPERVISOR=fqdn_of_vcenter (hostname in caps)
VADP_VM_NAME=hostname_of_vm (in caps)
VADP_TRANSPORT_MODE=san
DEDUPLICATION
Data Domain Backup
PROXY BACKUP
VMWare hostname_of_vadp_proxy:hostname_of_vcenter.fqdn(VADP)
Show versions of a folder or filename backed up
Recover> versions (defaults to current folder)
Recover> versions myfile
Add a file to be recovered to the “list” of files to be recovered
Recover> add
Recover> add myfile
List the marked files in the “list” to be recovered
Recover> list
Show the names of the volumes where the data resides
Recover> volumes
Relocate recovered data to another folder
Recover> relocate /nsr/tmp/myrecoveredfiles
Recover> relocate “E:\\Recovered_Files” (for Redirected Windows Client Recovery from Linux Svr)
View the folder where the recovered files will be recovered to
Recover> destination
Start Recovery
Recover> recover
SQL Server Recovery (database copy) on a SQL Cluster
First, rdc to cluster name and run command prompt as admin on cluster name (not cluster node) nsrsqlrc -s <bkp-server-name> -d MSSQL:CopyOfMyDatabase -A <sql cluster name> -C MyDatabase_Data=R:\MSSQL10_50.MSSQLSERvER\MSSQL\Data\CopyOfMyDatabase.mdf,MyDatabase_log=R:\MSSQL_10_50\MSSQLSERVER\MSSQL\Data\CopyOfMyDatabase.ldf MSSQL:MyDatabase
Delete the NSR Peer Information of the NetWorker Server on the client/storage node.
Please follow the steps given below to delete the NSR peer information on NetWorker Server and on the Client.
1. At NetWorker server command line, go to the location /nsr/res
2. Type the command:
nsradmin -p nsrexec
print type:nsr peer information; name:client_name
delete
y
Delete the NSR Peer Information for the client/storage node from the NetWorker Server.
Specify the name of the client/storage node in the place of client_name.
1. At the client/storage node command line, go to the location /nsr/res
2. Type the command:
nsradmin -p nsrexec
print type:nsr peer information
delete
y
VADP Recovery using command line
Prereqs to a successful VADP restore are that the virtual machine be removed from the Inventory in VCenter (right click vm, remove from Inventory), and the folder containing the virtual machines files in the vmware datastore be renamed or removed. If the vm still exists in vmware or in the datastore, VADP will not recover it.
Log onto the backup server over ssh and obtain the save set ID for your VADP “FULLVM” backup.
mminfo –avot –q “name=FULLVM,level=full”
Make a note of the SSID for the vm/backup client (or copy it to the cut/paste buffer)
e.g. 1021210946
Log onto the VADP Proxy (which has SAN connectivity over fibre necessary to recover the files back to the datastore using the san VADP recover mode)
Note that if you want to recover a VM back to a different vCenter,Datastore,ESX host and/or different resource pool, you can do that from the recover command too, rather than waiting to do it using the vsphere client. this can be used if your vm still exists in vmware and you don’t want to overwrite it. You can additionally specify VADP:host=VADP:datacenter=VADP:resourcepool=VADP:hostsystem= and VADP:datastore= fields in the recover command, separated by semicolons and no spaces.
I’ve found that whilst the minimal command above may work on some environments, others demand a far more detailed recover.exe command with all VADP parameters set before it’ll communicate with the VC. A working example is shown below (with each VADP parameter separated on a newline for readability – you’ll need to put it into a single line, and remove any spaces between each .
recover.exe -S 131958294 -o
VADP:host=vc.fqdn;
VADP:transmode=san;
VADP:datacenter=vmware-datacenter-name;
VADP:hostsystem=esxihost.fqdn;
VADP:displayname=VM_DISPLAYNAME;
VADP:datastore=“config=VM_DataStore#Hard disk 2=VM_DataStore_LUN_Name#Hard disk 1=VM_DataStore_LUN_Name”;
VADP:user=mydomain\vadp_user;
VADP:password=vadp_password
Creating new DataDomain Devices in Networker
In Networker Administrator App from NMC Console, Click Devices button at the top.
Right click Devices in the Left hand pane, New Device Wizard (shown)
Select Data Domain, Next, Next
Use an existing data domain system
Choose a data domain system in the same physical location to your backup server!
Enter the Data Domain OST username and password
Browse and Select
Create a New Folder in sequence, e.g. D25, tick it.
Highlight the automatically generated Device Name, Copy to clipboard (CTRL-C), Next
Untick Configure Media Pools (label device afterwards using Paste from previous step), Next
Select Storage Node to correspond with device locality from “Use an existing storage node”, Next
Agree to the default SNMP info (unless reconfiguration for custom monitoring environment is required), Next
Configure, Finish
Select new device (unlabelled, Volume name blank), right click, Label
Paste Device Name in clipboard buffer (CTRL-V)
Select Pool to add the Device into, OK.
Slow backups of large amounts of data to DataDomain deduplication device
If you have ridiculously slow backups of large amounts of data, check in Networker NMC to see the name of the storage node (Globals2 tab of the client configuration), then connect to the DataDomain and look under the Data Management, DD Boost screen for “Clients” of which your storage node will be one. Check how many CPU’s and Memory it has. e.g. Guess which one is the slow one (below)
Then SSH to the storage node and check what processes are consuming the most CPU and Memory (below)
In this example (above), despite dedicating a storage node backup a single large applications data, the fact that it only has 4 cpu’s and is scanning every file that ddboost is attempting to deduplicate means that a huge bottleneck is introduced. This is a typical situation whereby decommissioned equipment has been re-purposed.
Networker Server
ssh to the networker server and issue the nsrwatch command. It’s a command line equivalent to connecting to the Enterprise app in the NMC and looking at the monitoring screen. Useful if you can’t connect to the NMC.
Blank / Empty Monitoring Console
If you’re NMC is displaying a blank monitoring console, try this before restarting the NMC…
Tick or Un-tick and Re-tick Archive Requests.
Tape Jukebox Operations
ps -ef | grep nsrjb     -Maybe necessary to kill off any pending nsrjb processes before new ones will work.

nsrjb -C | grep <volume>    -Identify the slot that contains the tape (volume)

nsrjb -w -S <slot>      -Withdraw the tape in slot <slot>

nsrjb -d       -Deposit all tapes in the cap/load port into empty slots in the jukebox/library.
Note: If you are removing and replacing tapes you should take note what pools the removed tapes belong it and allocate new blank tapes deposited into the library to the same pools to eliminate impact on backups running out of tapes.
Exchange Backups
The application options of the backup client (exchange server in DAG1 would be as follows
Some pre-reqs on the VNX need to be satisfied before NDMP backups will work. This is explained here…
General tab
The exported fs name can be determined by logging onto the VNX as nasadmin and issuing the following command
server_mountpoint server_2 -list
Apps and Modules tab
Application Options that have worked in testing NDMP Backups.
Leave datadomain unticked in Networker 8.x and ensure you’ve selected a device pool other than default, or Networker may just sit waiting for a tape while you’re wondering why NDMP backups aren’t starting!
nsrndmp_save -s backup_svr -c nas_name -M -T vbb -P storage_node_bu_interface

or don't use -P if Backup Server acts as SN.
To back up an NDMP client to a non-NDMP device, use the -M option.
The value for the NDMP backup type depends on the type of NDMP host. For example, NetApp, EMC, and Procom all support dump, so the value for the Backup Command attribute is:
nsrndmp_save -T dump
Globals 1 tab
Globals2 tab
List full paths of VNX filesystems required for configuring NDMP save client on Networker (run on VNX via SSH)
server_mount server_2
List full paths required to configure NDMP backup clients (emc VNX)
server_mount server_2

e.g. /root_vdm_2/CYBERFELLA_Test_FS
Important: If the filesystem being backd up contains more than 5 million files, set the timeout attribute to zero in the backup group’s properties.
Command line equivalent to the NMC’s Monitoring screen
Running this in one go if you’ve not done it before is not advised. Break it up into individual commands (separated here by pipes) and ensure the output is what you’d expect, then re-join commands accordingly so you’re certain you’re getting the result you want. This worked in practice though. It will only reset Read Only (.RO) devices so it won’t kill backups, but will potentially kill recoveries or clones if they are in progress.
The NMC will tell you what the Client OS is, but it won’t elaborate and tell you what type, e.g. Solaris, not Solaris 11 or Linux, not Linux el6. Also, as useful as the NMC is, it continually drives me mad how you cant export the information on the screen to excel. (If someone figures this out, leave a comment below).
So, here’s how I got what I wanted using the good ol’ CLI on the backup server. Luckily for me the backup server is Linux.
Run the following command on the NetWorker server, logging the putty terminal output to a file:
nsradmin. type: nsr clientshow client OS typeshow nameshow os typep
This should get you a list of client names and what OS they’re running according to Networker in your putty.log file. Copy and paste the list into a new file called mylist. Extract just the Solaris hosts…
Now this script will use that list of hostnames to ssh to them and retrieve more OS detail with the uname -a command. Note that if SSH keys aren’t set up, you’ll need to enter your password each time a new SSH session is established. This isn’t as arduous as it sounds. use PuTTY right click to paste the password each time, reducing effort to a single mouse click.
This generates a file solaris_os_ver that you can just grep for ^SunOS and end up with a list of all the networker clients and the full details of the OS on them.
Wow. This is the coolest thing I’ve seen since vMotion. Watch from 15:00 for 40 seconds as Mark Shuttleworth migrates an entire infrastructure as a service stack from one public cloud in amazon ec2 to another public cloud in hp with juju. Just amazing.
Did you like this? Tip cyberfella with Cryptocurrency
The vmware esxi hypervisor with multiple nics can be configured a multitude of ways depending on the number of nics on board.
My lab hypervisors only have two, but that is enough to present a choice in itself, between splitting management, vmotion and iscsi traffic or alternatively teaming the two nics and putting all vmkernel ports, storage adapters and management traffic over a common active-active bonded link.
The lab environment has been running flawlessly for months with a physical split configured between management and vmotion/iscsi networks so I thought I’d configure up the “alternative” scenario and let that run to see how things go.
One thing to look out for when reconfiguring the networking on the ESXi hosts (apart from making sure all names of vmkernel ports match perfectly like before) is that the physical nics are both active afterwards.
Note one nic is in standby.
One of mine did it automatically, the other one didn’t. This left me in an unforeseen situation whereby I wouldn’t have been getting the full bandwidth benefit of both nics on one of my hosts while attempting to run everything over a single nic. This is definitely not recommended although in test, vmotion was still rapid -most likely due to very little else going on.
This would not be the case in a production environment and I’d certainly recommend migrating all your guests from any host that is being reconfigured and put it into maintenance mode. I didn’t do either of these things but that said, the whole point is to push my lab to breaking point and document the experience – which is what happened. More on that later.
Click on Move up, to make the second vmnic active.
With both nics active, you should see the following…
…both nics become active.
This change will possibly also require you to connect to the local console of each esxi host and manually restart the management network. This is certainly the case for earlier ESXi 4.0.0.
Upon removing the second vSwitch my ESXi host lost connection to the iSCSI datastore and thus the virtualcentre vm’s hard disk etc. Ordinarily this would not be a problem since in a clustered environment the other ESXi host would restart the guest, however the network configuration was in mid-change and thus did not match on both hosts in the cluster. This is called “Proper breaking it” from where I’m from but is where the real learning happens. Let it be in your back bedroom though and not on the datacentre floor. To recover from the situation I first attempted to shut down the vm using the unsupported console (covered in an earlier post), which the esxi host said was still powered on. It did not want to power off, or power on, or reset. In fact the esxi host didn’t want to reboot either so it got a hard reset in the form of me pushing in and holding in the power button and wondering if I’d have to build an out of band vm to install vsphere client on so that I could complete the network configuration of the esxi host.
After reboot, I’d noticed that the cluster had restarted the guests including the virtualcentre server on the other healthy host which I thought was pretty impressive since it saved me a bunch of hassle. This enabled me to continue reconfiguring the new vmotion vmkernel port on the bonded nics. A quick check over suggested everything was consistent except I’d lost visibility of the iscsi target. A quick rescan and it re-appeared and a successful vmotion of my DLNA server in mid-flight proved it was all healthy again. I’ll see how well it behaves unattended over the next few weeks / months. I’d like to know how I might force a rescan down the virtual iscsi storage adapter for the iscsi target where the datastore resides from the unsupported console though. I wouldn’t be surprised to find out it can’t be done, in which case I’d find myself installing vsphere client on another machine and doing it using the gui.
Did you like this? Tip cyberfella with Cryptocurrency
If you’re DataStores are using Fibre channel storage and you have multple fchba’s connected through to the SAN via a fc switch or two, then it is prudent to optimise the IO potential of all the redundant hardware by changing the fc path policy to “round robin”.
Using vsphere client, connect to the ESXi host / vcentre server
Inventory, Hosts and Clusters, select ESXi host
Configuration tab, Storage, highlight the datastore, click Properties
Click Manage Paths button on the DataStore properties dialog
Change Path Selection to Round Robin (VMWARE) – the default is Most Recently Used (VMWARE)
Wait for the screen to reload, Click Close
Repeat for each DataStore, and then Repeat for each ESXi host.
Did you like this? Tip cyberfella with Cryptocurrency
It’s not immediately obvious where you configure vm’s to startup automatically when the esxi host starts.
In Hosts and Clusters view (in Virtual Centre), click on the ESXi host – that’s HOST, not GUEST, i.e. the machine running vmware esxi, not the virtual machine itself.
On the Configuration tab, in Software settings, select Virtual Machine Startup/Shutdown.
By default, automatic startup of virtual machines is disabled, so you need to enable it before you can move the vms upwards into Automatic Startup. Click Properties in the top left hand corner and tick
Allow Virtual Machines to start and stop automatically with the system.
Select your DC and/or VC vm and move it all the way up so it exists in the Automatic Startup section of the Startup Order Dialog box.
Apply a delay if you want to, but don’t choose a value less than 90 seconds.
Did you like this? Tip cyberfella with Cryptocurrency
From experience, it’s not uncommon to not be able to connect to the KVM of a cisco ucs blade. Instead of seeing a Remote console screen, you’ll receive a “Connect failed” or “Request Shared Session” message, with no means of getting to the console.
Within the Service Profile, click on the Server Details tab. From there, click on Recover Server. Select “Reset CIMC (Server Controller)”. Choose Reset KVM Controller. This will kill existing KVM sessions and allow you to start a new session. Resetting the CIMC does not affect data traffic to/from the server NICs (ethernet and HBAs).
Another thing to check in Servers tab, General tab is the Management IP Address setting. If it’s configured to take an address from a pool, check the pool in the Admin tab, Management IP Pool, IP Addresses tab to see what IP’s exist in the range, and whats been assigned.
If a reset hasn’t worked, In the Servers tab, General tab, Management IP Address section, change the IP address from Pooled to Static. Use an IP address from the other end of the range in the pool. Click Save Changes, and try connecting to the KVM again.
[paypal-donation]
Did you like this? Tip cyberfella with Cryptocurrency